Device Management
-Devices-
Before reading the Devices chapter, please ensure you have read the Device Classes chapter to understand how classes help organize and manage your IoT devices.
Devices
The IoT Devices list is accessible from the menu Devices management>>Devices. The list page as shown below displays the devices that are allowed to be view and managed for the current user base on the user role and entity. Exemple a customer user can view only devices that are related to his entity, as seen in the Entities sections in the Application Settings chapter.
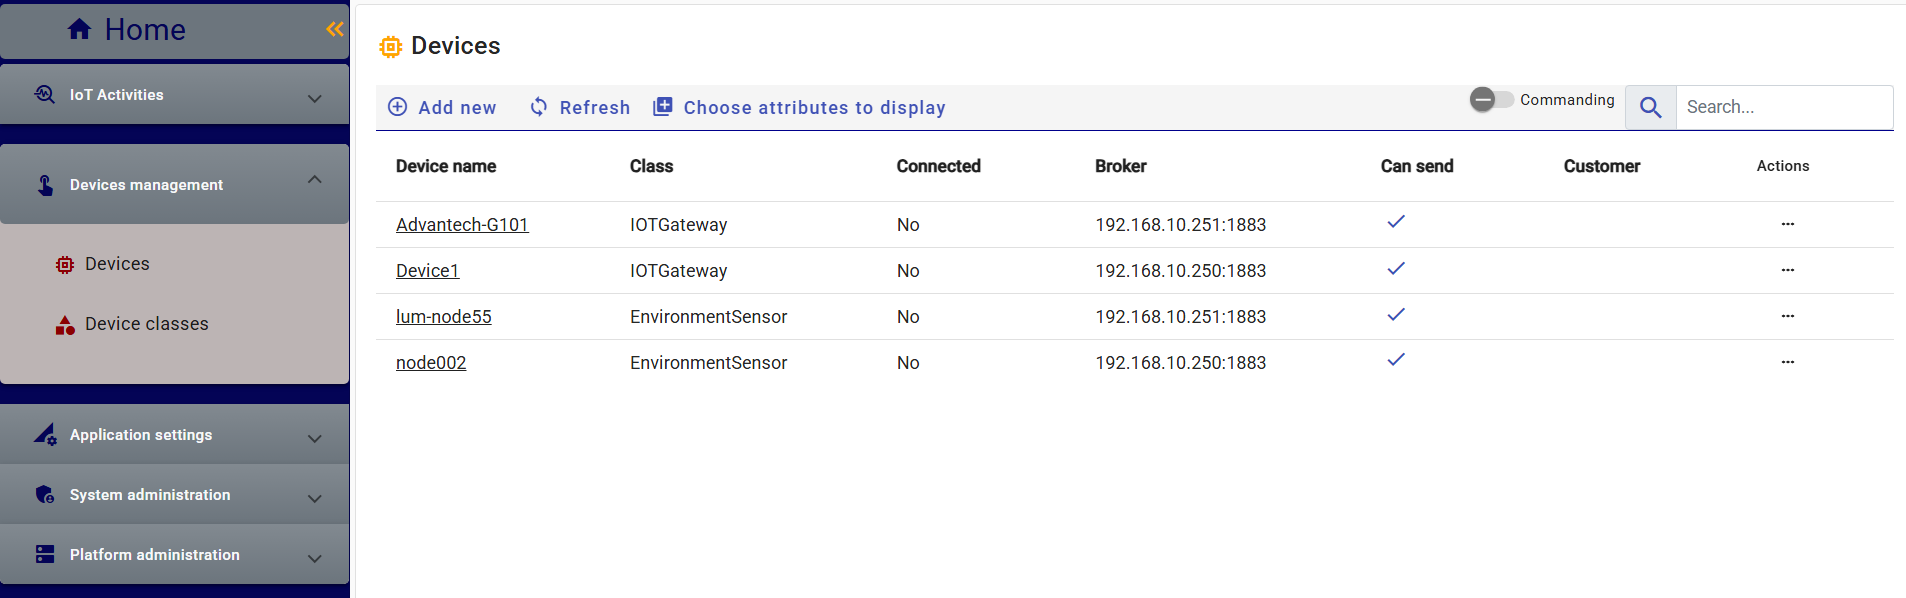
Devices can be added in two way :
- Manually by clicking the “Add new” button in the toolbar. A pop-up window opens to let the user enter information such as Device Name, ID, and Device Class. The other information are configuration automaticcaly base on the selected class like Attributes, Functions and Commands.
Or by registering to the platform — either via direct connection (on first subscription) or when the Device ID is sent for the first time through a gateway. In this case, the new device is assigned by default to a class based on predefined settings (which the user may change).
As indicated in the General Settings section under Application Settings, there are two parameters:
- Default class for new registered device/gateway : Device that connect directly to the platform.
- Default class for new registered node : Device with information sent via gateway
Devices List view
The information displayed on the list page includes the primary fields describing the device and its status — such as Device Name, Device Class, current connection status, ability to send messages to the platform, and the associated customer entity (if any). The other information like attributes and measurement ledger can be view when display a device detail page.
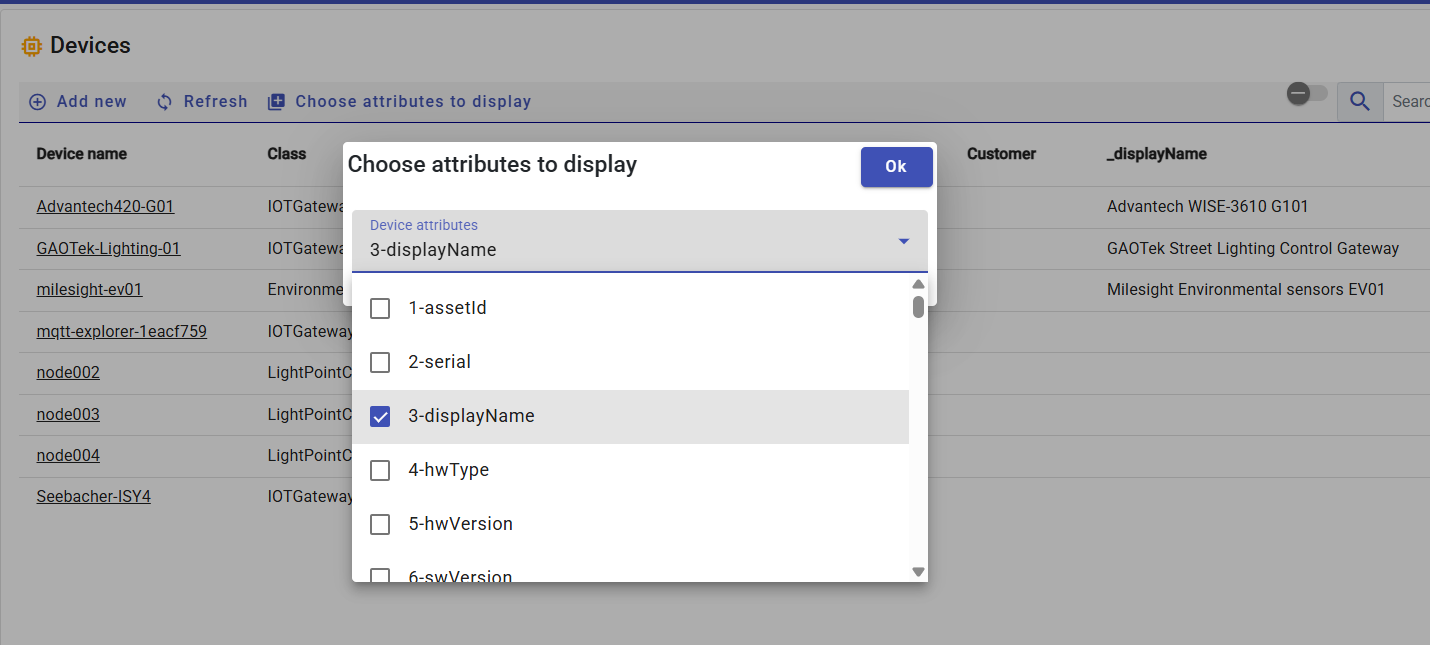
Users can also select which device attributes to display and search by them via the “Choose Attributes” button in the toolbar.
Device detail page
Selecting a device from the list opens its detail page, where you can review or modify:
- General information (name, description, identifiers, class)
- Communication settings (gateway, broker, topics)
- Current attribute values (real-time data view)
- Device-specific configurations and status indicators
- Access to the Attribute Ledger by date to view value history
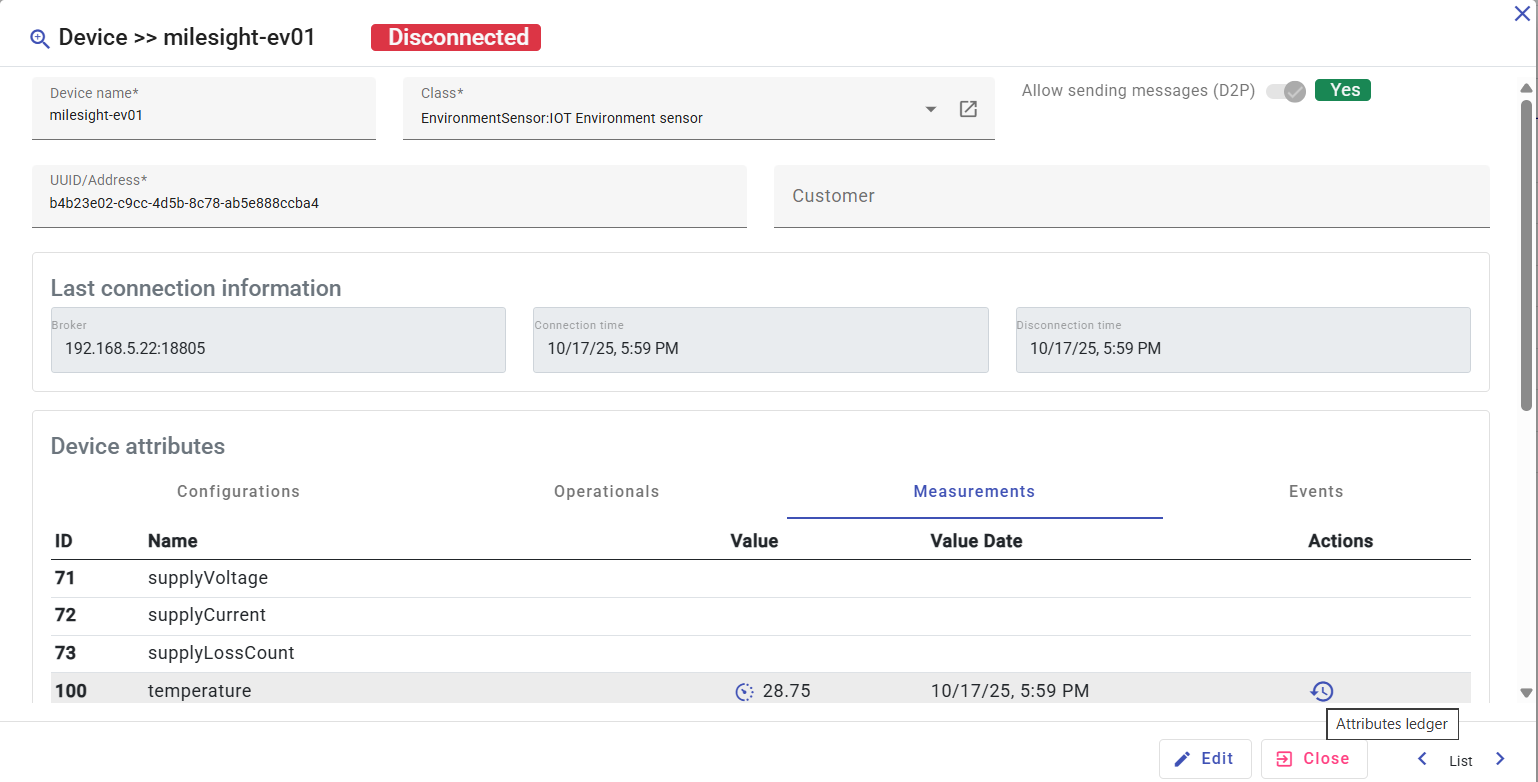
Each device reports attribute values through messages received by the broker.
Attributes can represent configuration data, measurements, or events, depending on the device functions defined in its class.
All received attribute values are stored in the Attribute Ledger, which maintains:
- Value history by timestamp
- Normalized representation of data
- Links to the originating device and message batch
For large attributes such as images, audio, or video, the ledger stores a reference, while the actual data is saved in the platform’s bucket file database.
Device commanding from list view
Each device supports one or more commands defined in its associated class.
Commands can be executed from the following contexts:
- The Control Table (batch commands for multiple devices and multiple command)
- The Device Page (manual execution for a multiple devices and single command)
- Workflows (automatic or event-driven commands)
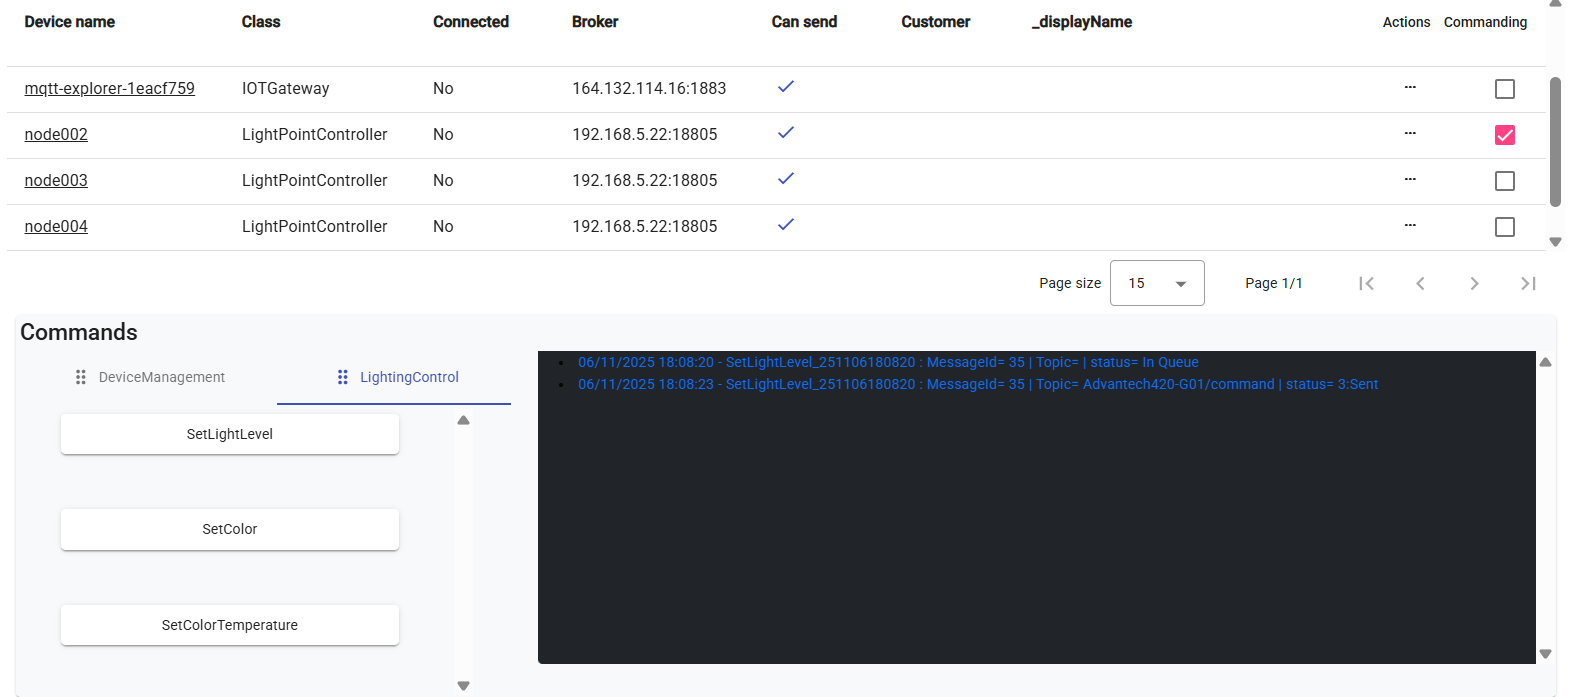
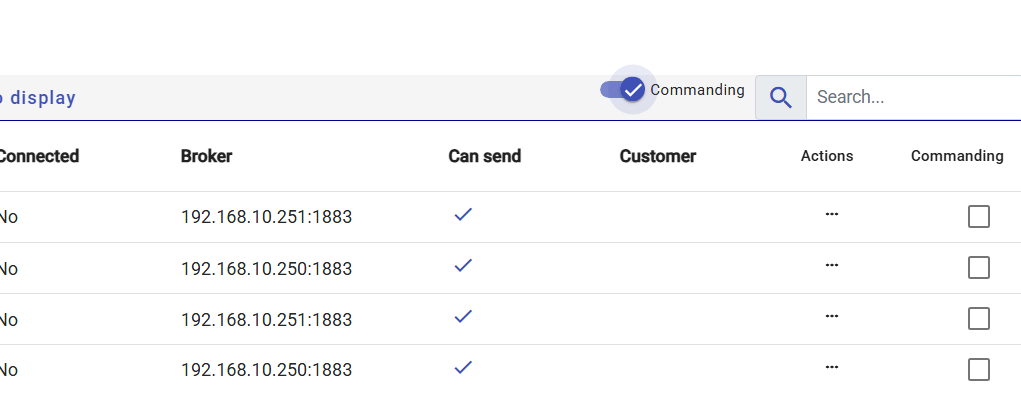
From the Devices List View, users can toggle the “Commanding” button in the toolbar to enter command mode.
When enabled, an additional checkbox column appears, allowing users to select one or more devices to receive the chosen command.
Once one or more devices are selected, a Commanding Zone appears below the list view. This area provides a complete interface for managing and monitoring command execution. The Commanding Zone includes:
Command Tabs (Left Side):
Commands are organized by Command Group (as defined in the associated Device Class).
Each tab lists the available commands for that group and allowed for the current user role.Output Screen (Right Side):
Displays real-time information about command execution, including:- Command status and results.
- Any updated attribute values returned by the device
- Optional live data streams or visual outputs (based on attribute type)
Displaying Updated Attribute Values
The option to show updated attribute values in the Output Screen after a command is sent is configurable per command in the Device Class settings.
Administrators can define:
- Whether to display the value once (single response), or
- Enable continuous reading (simulated live monitoring).
The Output Screen intelligently adapts its rendering based on the attribute type and data frequency:
- Text or Numeric attributes: simple value display
- Media attributes: render images or videos
- Continuous numeric readings: display dynamic charts or graphs
This provides a flexible, visual way to monitor device responses and confirm command execution results.
Below is an example of the command SetLightLevel executed for one selected device.