Operations
- Attributes Explorer -
The Operations module groups the core day-to-day functionalities of IoTRoutes that users interact with for data analysis, monitoring, and command management.
These functionalities enable users to explore data generated by connected devices, send or monitor commands, and trace workflow executions.
Device Attributes Explorer
The Device Attributes Explorer module allows users to browse, filter, and analyze attribute values collected from connected devices.
It provides a flexible interface to explore real-time or historical attribute data, apply filters and aggregation methods, and visualize results as tables and charts.
This module is accessible from the Operations menu.
The Device Attributes Explorer is composed of three main sectionsEach section contributes to defining the exploration scope, the analysis criteria, and the visualization of results.
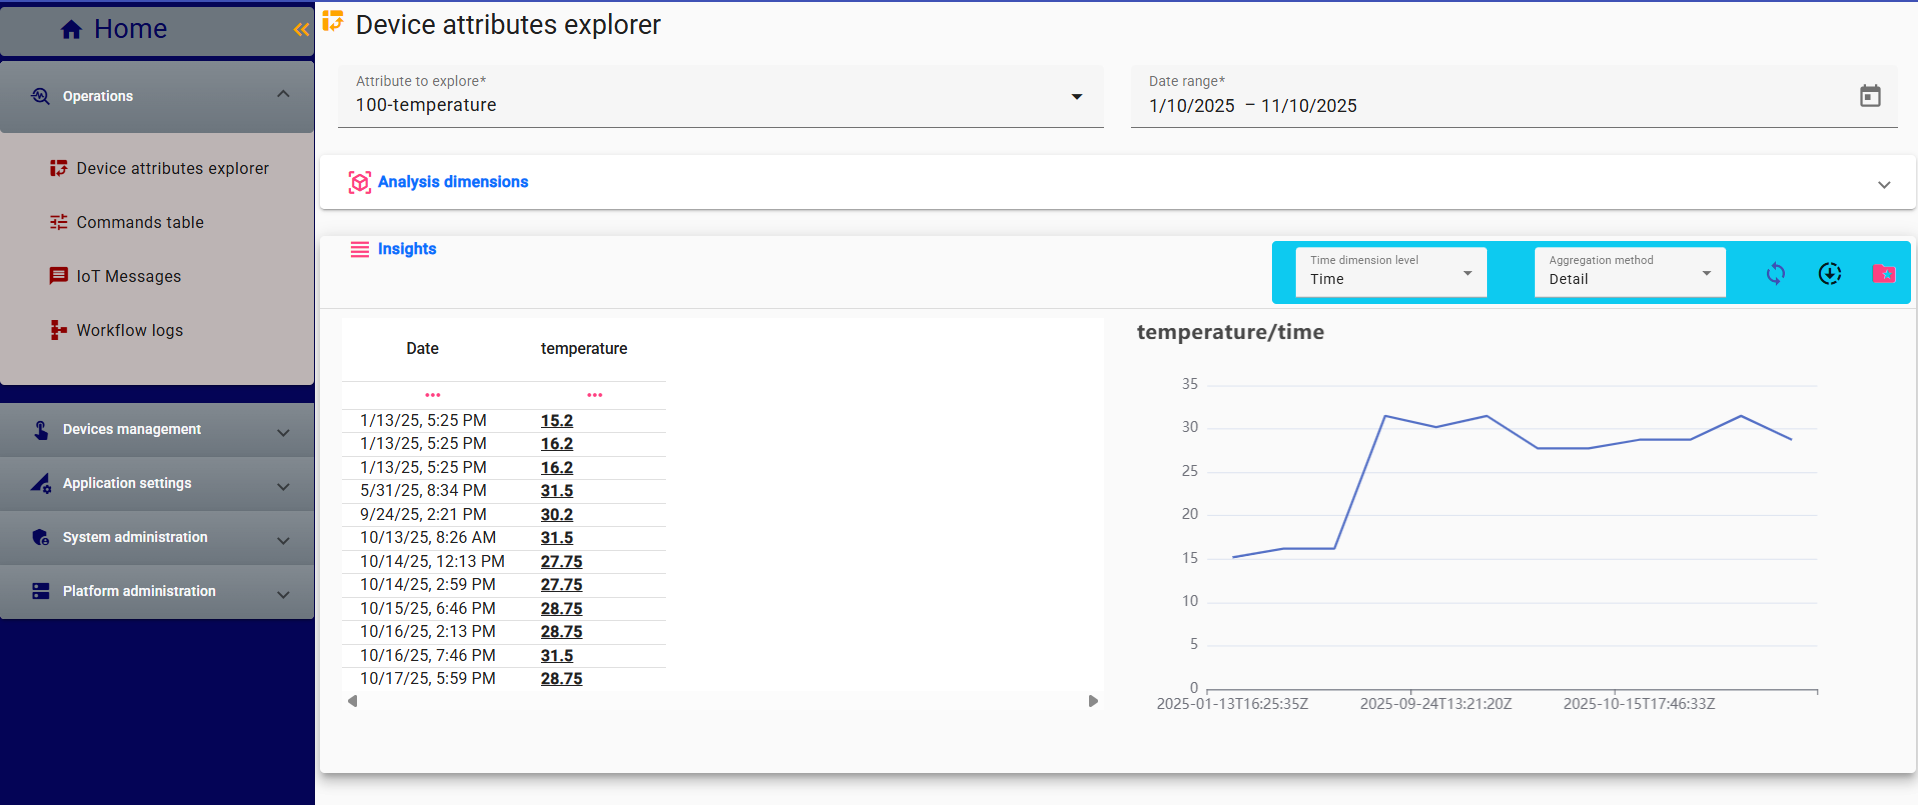
Target Selection
This section defines what attribute the user wants to analyze and for which period.
| Field | Description |
|---|---|
| Attribute to Explore | Autocomplete field allowing selection of an attribute by name or ID. Once selected, data related to this attribute will be loaded from the attribute ledger. |
| Date Range | Specifies the time period for which attribute values are retrieved. The selected range filters the ledger data used in the analysis. |
Analysis Dimensions
This section provides filters and analytical axes to refine the dataset and group values by context or metadata.
| Dimension | Description |
|---|---|
| Interpreted Level | Filters attribute values according to their interpretation level (e.g., Normal, Faulty, Good, Needs Attention, etc.) as defined by the Attribute Interpreters. If not selected, all ledger lines are included. |
| Device Classes | Restricts the analysis to specific device classes. If none selected, data from all classes is considered. |
| Devices | Filters data to specific devices within the selected classes. Optional. |
| Analysis Axes | Defines additional operational or configuration attributes used to cross-analyze the selected attribute. Examples include Region, Location, Hardware Type, or Gateway ID. |
Each dimension can be used individually or combined to obtain multi-dimensional insights.
Insights
The Insights section displays analysis results in two synchronized views:
- Grid View (left): Tabular results listing time-stamped attribute values or aggregated data.
- Chart View (right): Visual representation of the same data (e.g., temperature over time).
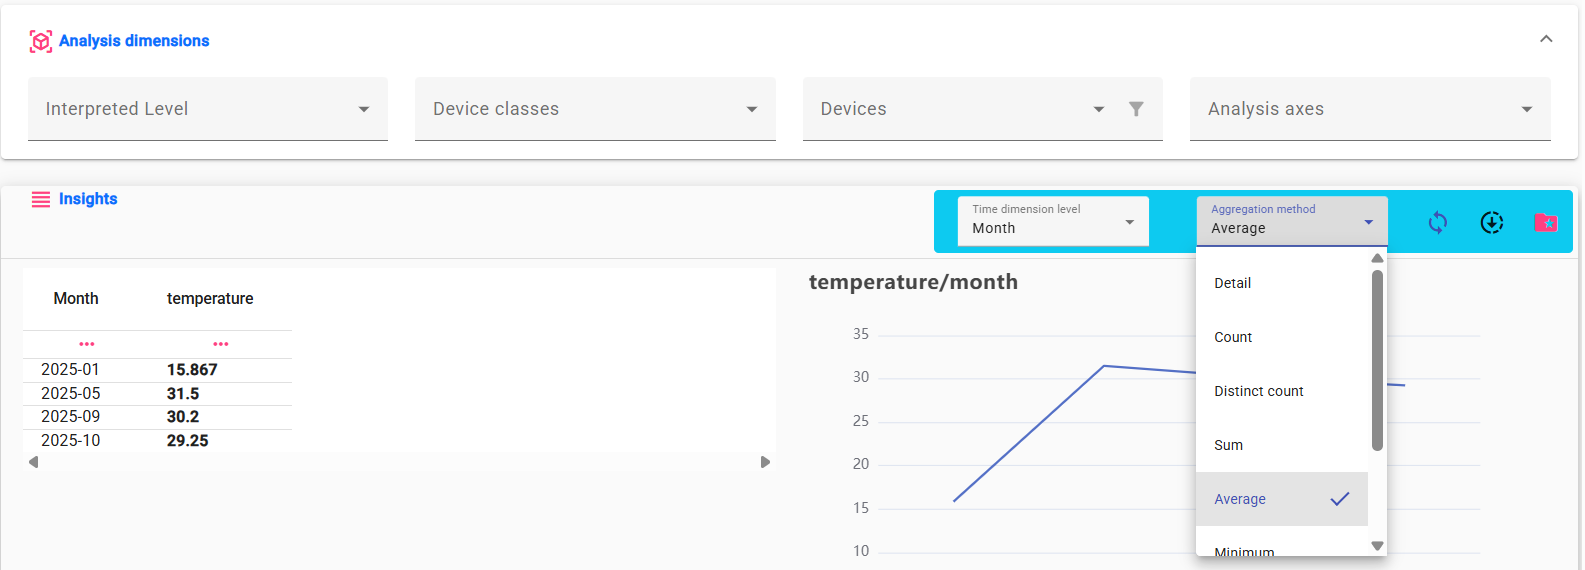
Insight Options
| Option | Description |
|---|---|
| Aggregation Method | Defines how values are aggregated. Options include Count, Distinct Count, Average, Sum, Min, Max, Percent, or Detail (no aggregation). |
| Time Dimension Level | Specifies the time grouping used for aggregation: Time, Hour, Day, Month, or Year. |
Together, these options allow users to summarize large datasets or display detailed records as needed.