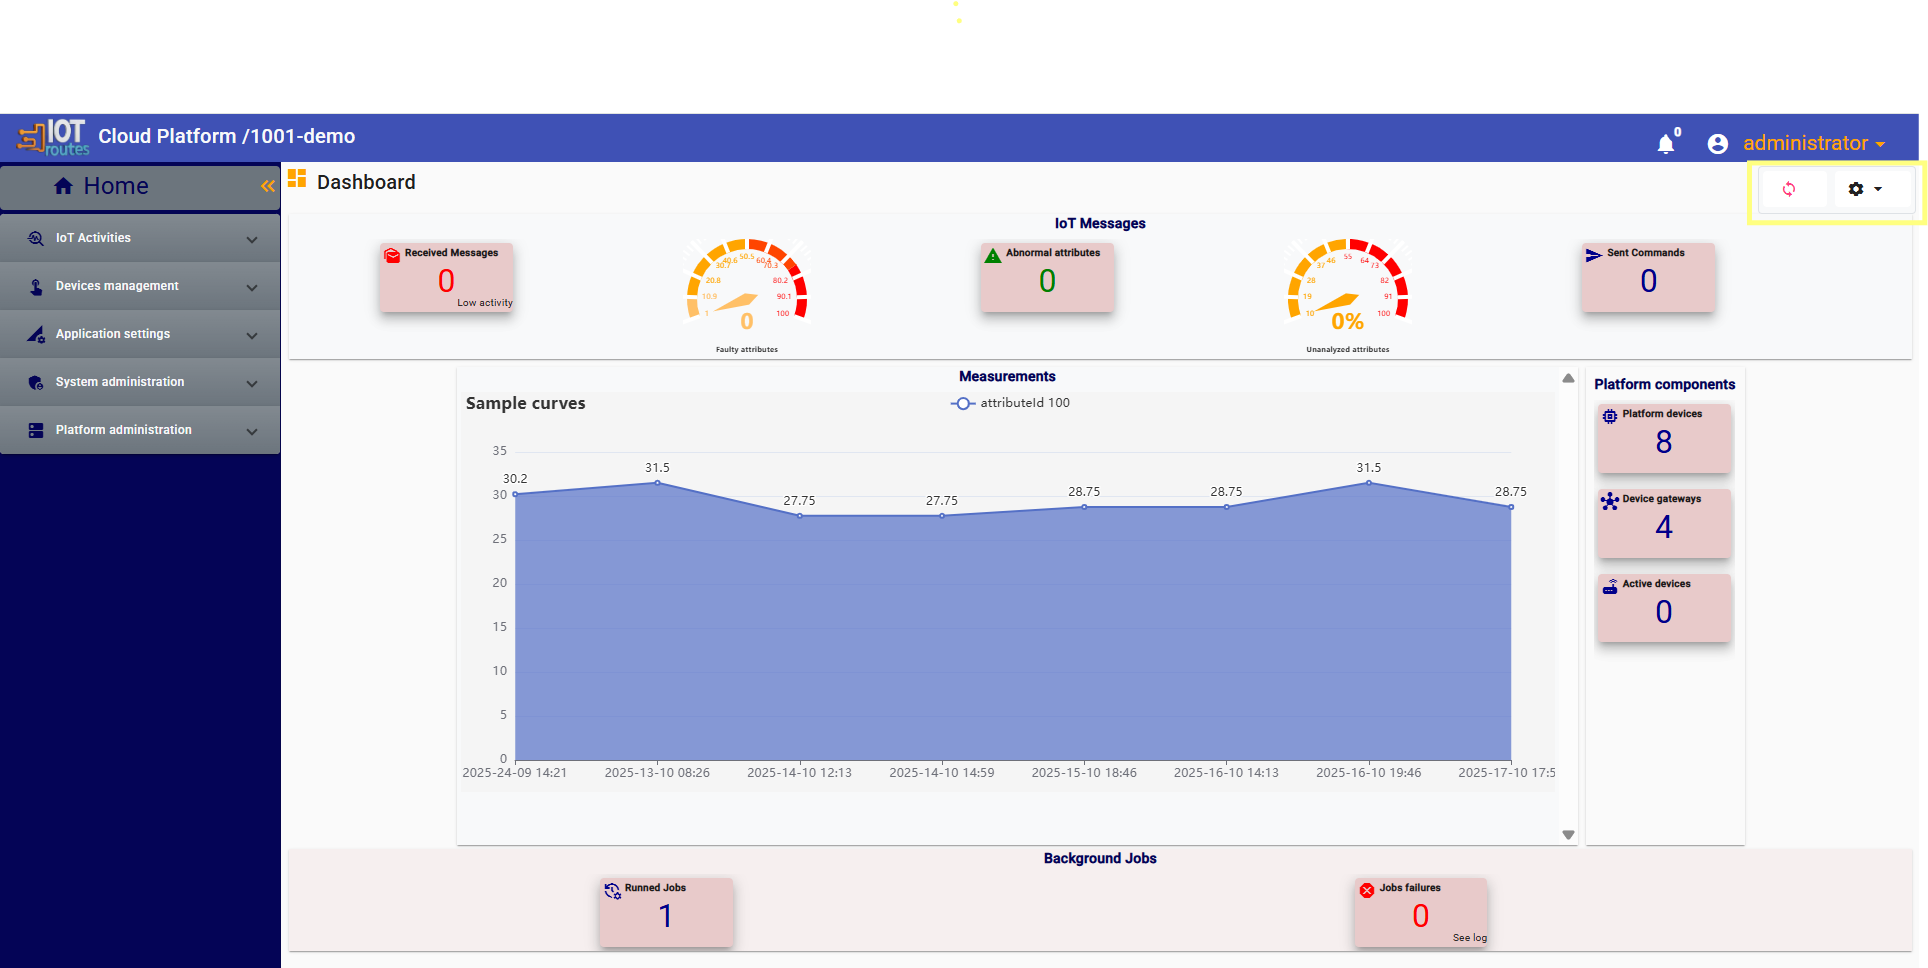
Dashboard
The Dashboard is the main visualization space of IoTRoutes, automatically loaded after login and accessible via the Home button.
It provides a consolidated view of the platform’s operational health, data flow, and device activities through configurable KPIs (Key Performance Indicators).
Layout and Regions
The dashboard is divided into five regions:
- Header – For global or system-level KPIs.
- Content – Central area for detailed charts and time-series visualizations.
- Left Side – For contextual or navigation KPIs.
- Right Side – For device or gateway metrics.
- Footer – Typically reserved for background jobs or workflow indicators.
Each region displays KPIs according to:
- Their default display zone defined in KPI settings.
- The user role (system admin, functional user, or security admin).
Only the KPIs relevant to the user’s role are visible.
Default and Custom Dashboards
By default, a main dashboard is automatically created after platform deployment.
Users can later:
- Create new dashboards.
- Rename dashboard regions to match their content (e.g., Header → “System Insights”).
- Reorder KPIs or move them between regions.
- Remove KPIs that are not relevant.
- Edit the dashboard title to personalize it.
This enables every user to design a workspace adapted to their role and operational focus.
Dashboard Mini Toolbar
Located at the top-right of the dashboard, the toolbar provides the following actions:
| Button | Description |
|---|---|
| 🔄 Refresh | Recalculates KPI values (with a minimum interval of 2 minutes between recalculations to preserve performance). |
| ✏️ Edit | Activates edit mode, enabling rearrangement and customization of dashboard layout and region titles. |
| ➕ Add New | Creates a new dashboard. |
| ♻️ Clear Changes | Restores the default layout and KPI configuration. |
KPI Interaction and Drill-Down Navigation
Each KPI card or gauge displayed on the dashboard can be interactive.
If a URL for Detail was defined in the KPI’s display options, clicking the KPI redirects the user to the corresponding page — usually a filtered list or chart providing detailed data behind the KPI’s value.
For example:
- Clicking Faulty Attributes may open the Attributes Ledger filtered by faulty records.
- Clicking Jobs Failures may open the Workflow History list filtered by failed jobs.
This behavior allows intuitive exploration from summary insights to operational detail.
Dashboard Edit Mode
The Edit Mode is accessed through the Edit button in the dashboard toolbar.
It allows modification of the dashboard layout, captions, and KPI arrangement.
When clicking on Edit, two options are available:
Below is an example of a standard dashboard in edit mode, showing draggable KPI widgets and editable region titles.
1. Edit (Global Edit Mode)
This mode applies global changes to the dashboard layout and is intended for administrators.
- Changes affect all users of the current UI culture (language).
- Captions modified in this mode (dashboard title, region names, KPI labels, etc.) apply only to the current language version.
To localize captions for other languages, the user must switch the interface language and repeat the adjustments. - Typical global modifications include:
- Renaming dashboard regions (e.g., “Header” → “System Insights”).
- Reordering KPIs within or across regions.
- Updating the dashboard title.
- Hiding or showing default KPIs.
💡 Note: Global edited captions are stored per language.
You can maintain independent captions for each culture.
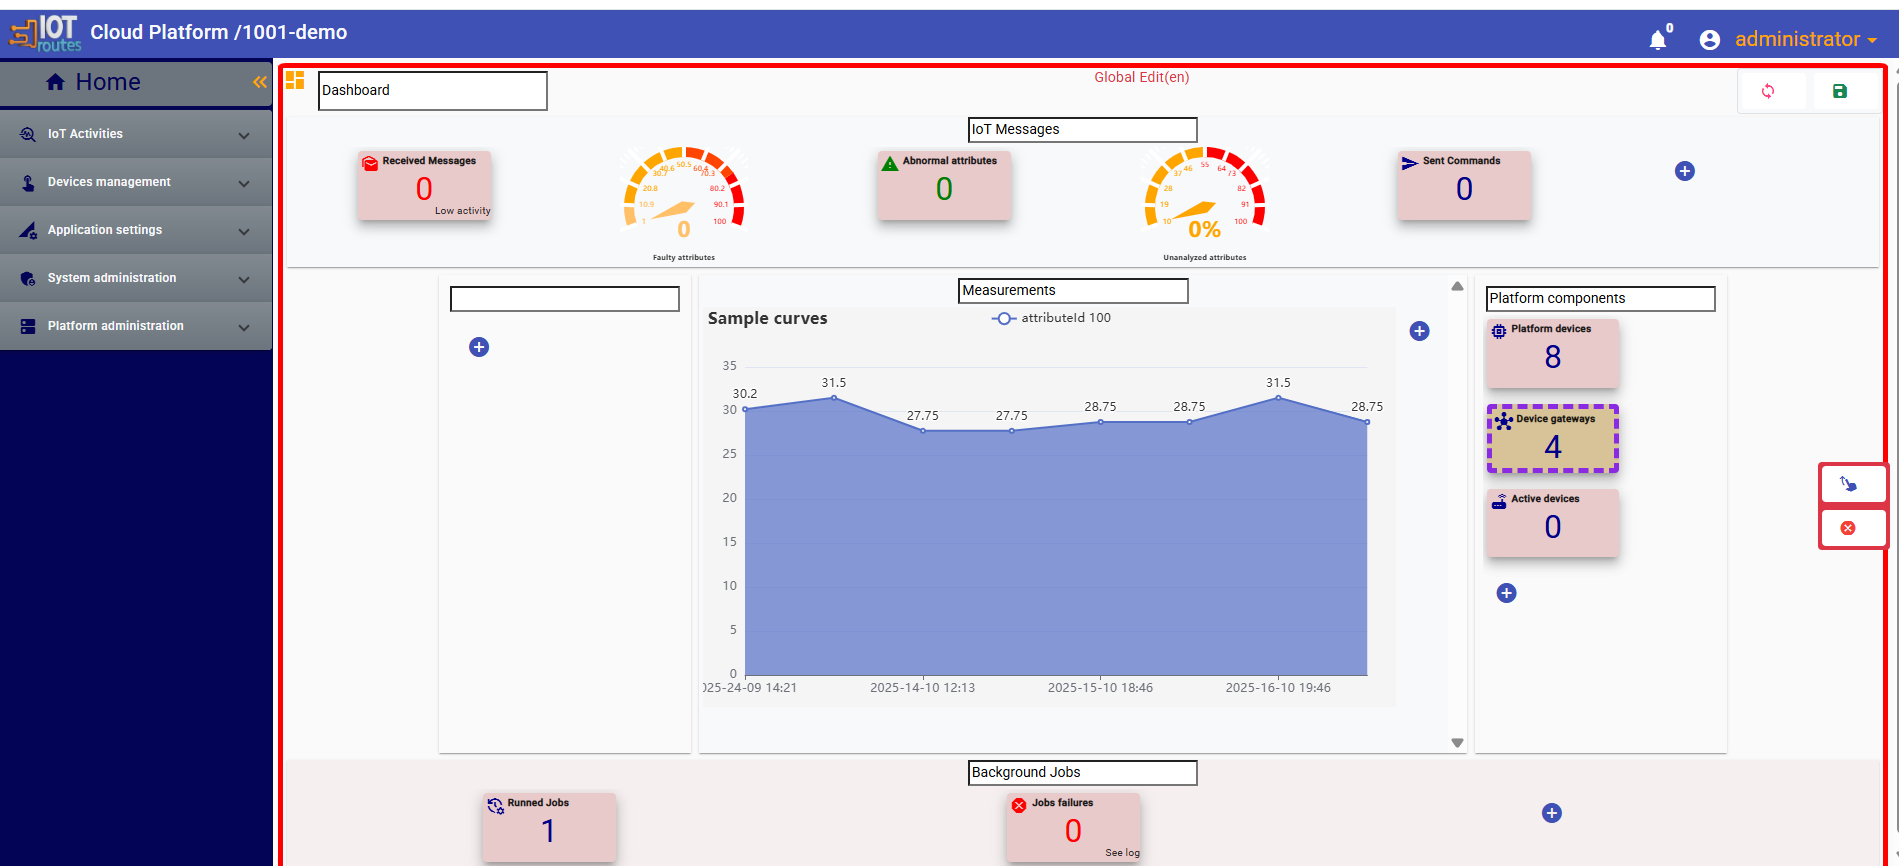
2. Customization (User-Specific Mode)
This mode is used for personal dashboard customization.
Changes made here affect only the current user and are saved as individual preferences.
User-level customization allows:
- Reordering KPIs.
- Moving KPIs between regions.
- Changing region captions.
- Hiding or showing KPIs according to personal needs.
These customizations override the global dashboard settings only for the connected user and do not affect other users’ dashboards.
Saving and Resetting Changes
Once edits or customizations are made:
Click Save (✔️) to apply and persist changes.
Click Clear Changes (♻️) to revert the dashboard to its default configuration (either global or personal defaults depending on the mode used).